The worst example I can think of recently was the Lewisham Lib Dem leaflet that insisted during the European elections that "Only the Lib Dems can win here" despite the fact that the elections are conducted under proportional representation. Of course when the result came out they had won one seat out of eight, just like the Greens - and the claim that only they could win was quietly forgotten. (In case you think I'm picking on the Lib Dems check out this recent Tory bar chart from Manchester that will make your mind boggle!)
So in the interests of full disclosure I thought I'd let people know how electors actually voted in Crofton Park, which is where it will count for the local elections. We don't have a Crofton Park break down for the most recent elections, the Europeans earlier this year, although if you're interested you can see how Lewisham as a whole voted here where you'll see that the Greens came second behind Labour with the Tories third and Lib Dems fourth.
This first graph is how people voted in Crofton Park ward at the election prior to that, the London Assembly elections of 2008 that saw Boris Johnson elected as Mayor, a sad day I'm sure all but 17.9% of us can agree.

Labour's really given up the ghost in the area so it's unlikely they'll be benefiting from Ken's electoral boost this time round at the council elections. That puts the Greens in a good position as the party with the second highest number of votes last time round and the Lib Dems look in pretty bad shape trailing in a very weak fourth place.
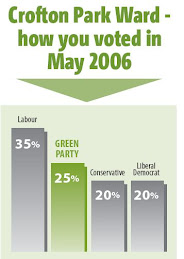
However, the election results that are most relevant for the locals is the local elections last time round, in 2006. Here we've averaged the vote of each of the three candidates of the four main parties, but if you want to check there's been no jiggery pokery you can read the full breakdown for yourselves here.

This result was a real surprise for us as we hadn't realised we had this much support in the area. Our top placed candidate Jeremy Hicks, who is now our election agent, would have needed just 137 more votes to have gained a council seat. Since then Crofton Park residents will know we've really stepped up our campaigning in the area and we're getting a great response on the doorstep.
Anyway, I hope these figures are useful and feel free to pull me up on them if you think I've played fast and loose with the facts. I certainly recommend that whenever you see a political leaflet with a bar chart on it pay careful attention to what poll they come from and whether they are in any way relevant to the election you are voting in.

No comments:
Post a Comment